[Read me]
—
This is not financial/investment advice.
—
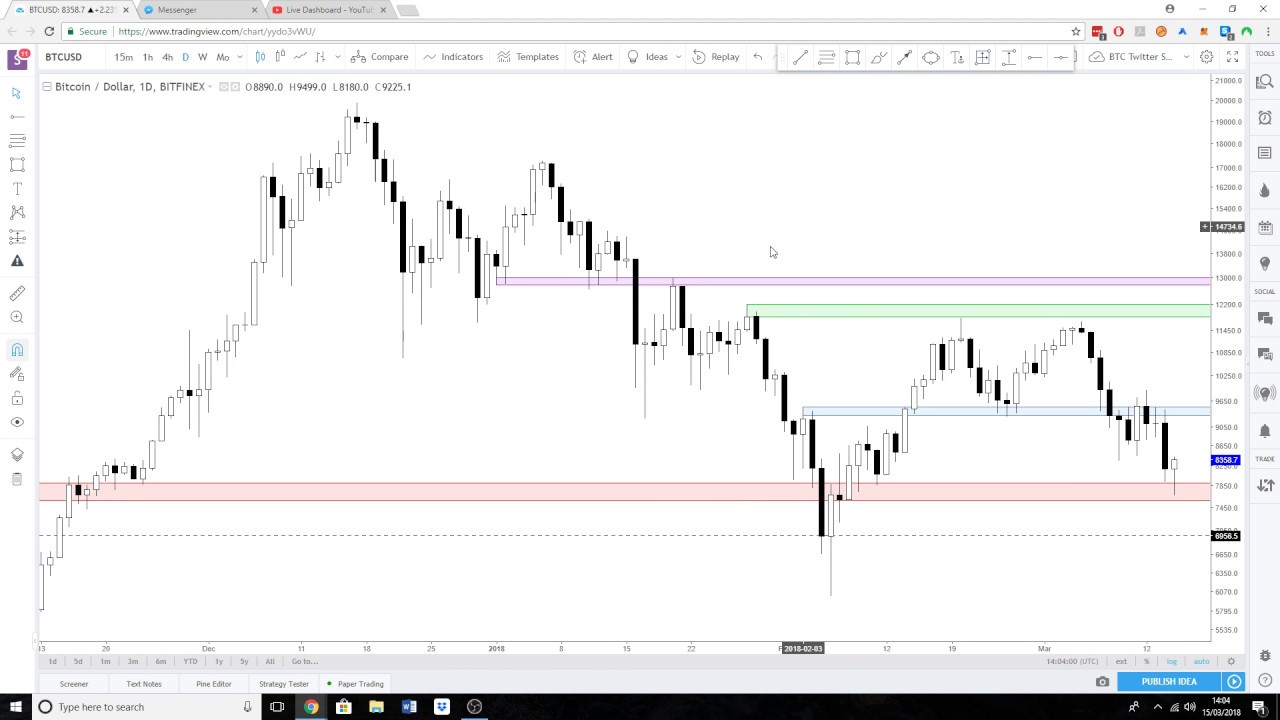
In this video, I offer a technical analysis of Bitcoin (BTC) using price action and some technical indicators.
This video focuses on Bitcoin’s continued fall in price, and a test of a very significant weekly time frame support level.
Liquidity pools explained:
$BTC Educational Chart
Liquidity Pools: A Short Explainer
This market is getting serious. Evolve or lose your money. pic.twitter.com/qRD8rZWt29
— Cred (@CryptoCred) February 24, 2018
—
My free TA Telegram: https://t.co/gCiaQeTsVa
Twitter: https://twitter.com/cryptocred


??✌✌
Amazing analysis man, I left you're video much more clearheaded about the main levels to watch and their significance. I also really got to understand the RSI to its fullest with you're video, and you're ichimoku cloud video helped me 2 times more than a 1 hour video i watched at 1.25 spd about the subject. Thanks, keep up the great work.
Great job, you have a gift of explaining your self well. You make it easy to understand these complicated markets.
Thanks! perfect as always . love your style
These analyses are great! Would you be willing to make one for ETH? 🙂
appreciate
Thank you Cred for all this awesome information. You are making people smarter and really more educated. And yeah, your way of explaining things is superb clear and includes no unnecessary info, like e.g. Philakone usually deliver. Thank you, mate!
Cheers mate!
Great job as always!
Thanks Cred. Emergency evening update would be wonderful. lol
Thank you very much Cred. This is an impeccable chart!
@Cryptocred – What do you think about the seemingly immanent death cross between the 50 and 200 daily EMA? Also, which would you give more priority to in Bitcoin, EMA or MA with regards to a potential death cross?
Братан, спасибо тебе. Ты мне реально помогаешь! Не сбавляй обороты. И еще ты мне говорил, что на русском запустишь может быть!
brillant job mate!!
Thank you once again, for a brilliant TA. As good as it gets! Hat's off!
Hi Cred, thanks for this amazing education! ? I'm binge watching your videos during the last days, exciting stuff! And very well structured! ? Really want to learn more about trading this crazy crypto market… Can't wait for more great content , so keep it up! ?
I wish I watched you before. I would be much more comfortable buying at 7.5k. For a short tearm bullish trade
Really like your high level objective approach. Awesome.
would like to see how u use ichimoku cloud here. thank u 4 the update
Cryptocreed keep it up. I hope to keep watching your videos in the future and I believe them to be very informative and straightforward for young newcomers like myself.
cheers
Is the "On Balance Volume Oscillator [LazyBear]" available only to users with a paid subscription? won't show up on my list
I'd like to see you do a video teaching basic market structure… because I certainly don't understand it.
Thank you for the analysis. Always appreciate different perspectives. Only question I have is I notice most TA is done using Bitfinex charts. May I ask why this chart and not others?
thnx for update.
thanks a lot , keep the great work
1)
15:50
Acting as resistance because it is *ABOVE the price – apologies
2)
For the daytraders – intraday support turned to resistance at 8.5k (which I cover at 1:55 and last video) is important IMHO
Very solid analyses. Thanks, mate 🙂