


What is a Bitcoin?
Bitcoin is a digital currency, or cryptocurrency, exchanged over the internet using a cryptographic system that secures transactions through blockchain technology as a shared ledger kept on several computers in different locations. In this way, it is very difficult for the system to be hacked.
What is Bitcoin Chart?
Graphics are designed to show information about a particular topic in a simple and instantly understandable way. People can do evaluations without having to “read” a lot of boring technical material through graphics. Bitcoin charts can help interested parties see and understand the information healthily faster and more accurately. Understanding bitcoin charts will allow for better hedging exercises, thus providing better savings.
Keeping track of the bitcoin price and its general direction can help you know when to buy, hold, or sell. Since reading bitcoin price charts can often be daunting for beginners, we created some simple steps here.
- Understanding the bitcoin price chart
- Types of bitcoin price tables
- Understanding the bitcoin price chart:
Although the value of bitcoin must be derived from its adoption and use in general, the prices do not always reflect this. As with all tradable assets, bitcoin prices are heavily influenced by external factors such as public sentiment, supply and demand, and sheer speculation. As with all cryptocurrencies, there is no single price for bitcoin at any given time. Different markets trade at different rates, depending on the fees involved, available volume, and even the whims of large individual investors (aka whales).
Even if prices tend to converge in the long run, you should expect them to deviate from this average, sometimes considerably, depending on where you look. Each exchange maintains its books, and individual sellers are free to set their prices, just as buyers accept or reject them. In this article, we describe the two most common types of charts and the most popular platforms that offer them.
Types of bitcoin charts
The different types of bitcoin charts include:
- Charting information on the total bitcoins in circulation
- The market capitalisation information
- The total transaction fees on a daily tracking scale
- The number of different types of transactions and many more
Each bitcoin diagram is designed to provide all up-to-date information for the convenience of easy viewing of those looking for particular bitcoin-related information. The financial and technical data acquired from these charts certainly makes understanding bitcoin charts and how to use them as exercises interesting. Some bitcoin charts include but are not limited to Bitcoin Difficulty Historical Data Chart, Bitcoin Market Exchanges Data, Bitcoin Exchange Rate Charts, Bitcoin Difficulty Prediction Charts, etc.
Those who show interest, such as traders and early adopters, understandably require a comprehensive way of interpreting the change in bitcoin price, its fundamental influences and the market’s general direction. Knowing more about a bitcoin’s value is another important exercise that should ideally be mastered if profits are to be sustained. Bitcoin has already been established to revolutionise the way financial transactions are executed.
The positive fallout from those who use bitcoin is enough to create more enthusiasm for this ascendant and future style. Many different and independent nonprofits have agreed that it has a lot of potential in the cryptocurrency arena. The excitement of bitcoin is only replaced by its revolutionary payment transfer system, which is fast and efficient while practising all non-discriminatory features. The value of bitcoin mainly rests on its potential to ensure that transaction fees are kept to a minimum and certainly lower than the classic styles of transactions available today.
The two main types of bitcoin charts show the level of detail the user wants. Some users want a simple, easy-to-digest representation of the bitcoin price movement.
- Simple price charts: The bitcoin simple line price chart must be very familiar from school days of plotting data on two axes. It shows the price on the vertical Y-axis (Euro, Dollar, etc.) over time on the horizontal X-axis, which can be seen by day, week, month, or hour, depending on the granular form you want to get.
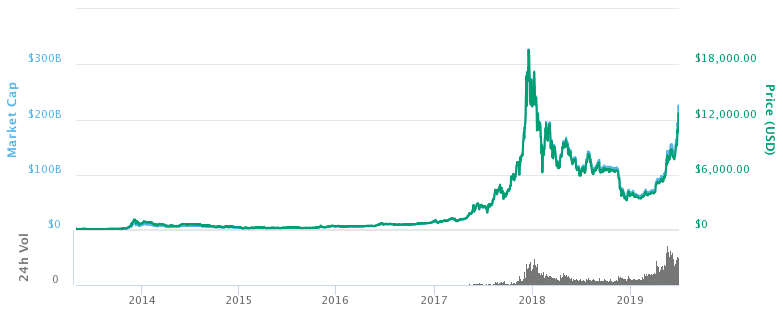
The most popular provider of these simple charts is Coinmarketcap, which has grown to become the famous index for cryptocurrencies. It offers price averages for the most notable tradable coins and tokens, and some consider that the closest one can fetch an “official” price. These charts are great for quick reference but lack detail and don’t reflect the (sometimes huge) price disparity across markets. Yet, aggregators like Coinwarz offer plotted charts with prices broken down by exchange.
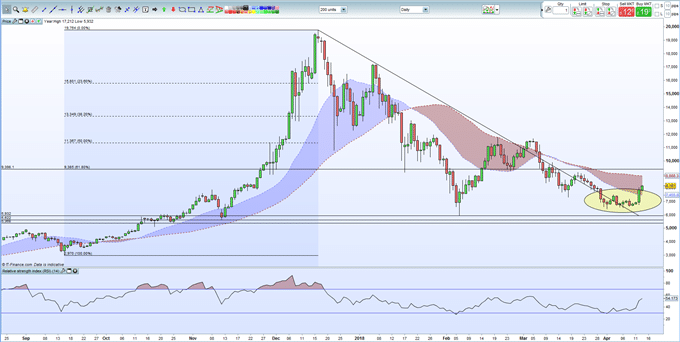
- Bitcoin candlestick charts: A bitcoin candlestick chart is so named because a vertical candle-shaped rectangle replaces the individual data chart points of a simple chart with a wick at the top and bottom. This is where the Trading view reigns supreme, providing investors and even some exchanges like Bitfinex and Bitstamp with high levels of detail and customisation. You can even go back to find historical price movements for each exchange.
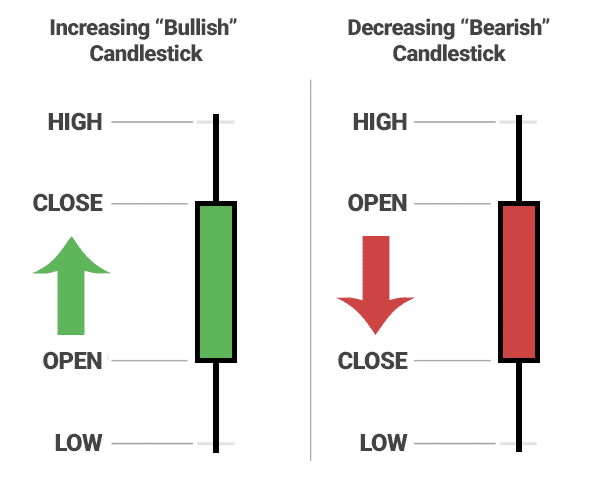
The rising and falling prices within a candle period are differentiated by colour to make the price trajectory easier to discern. Green indicates that the price rose within the range of the period, while red indicates that the price fell. The candlestick components decompress a simple closing price value for a given period that tells you the following, as represented by the letters and numbers in the upper left corner. All businesses realise that they need to stay up-to-date to enjoy continued expansion and success. This favours the growth of bitcoin, as more companies want to extend this convenience to their customers.


