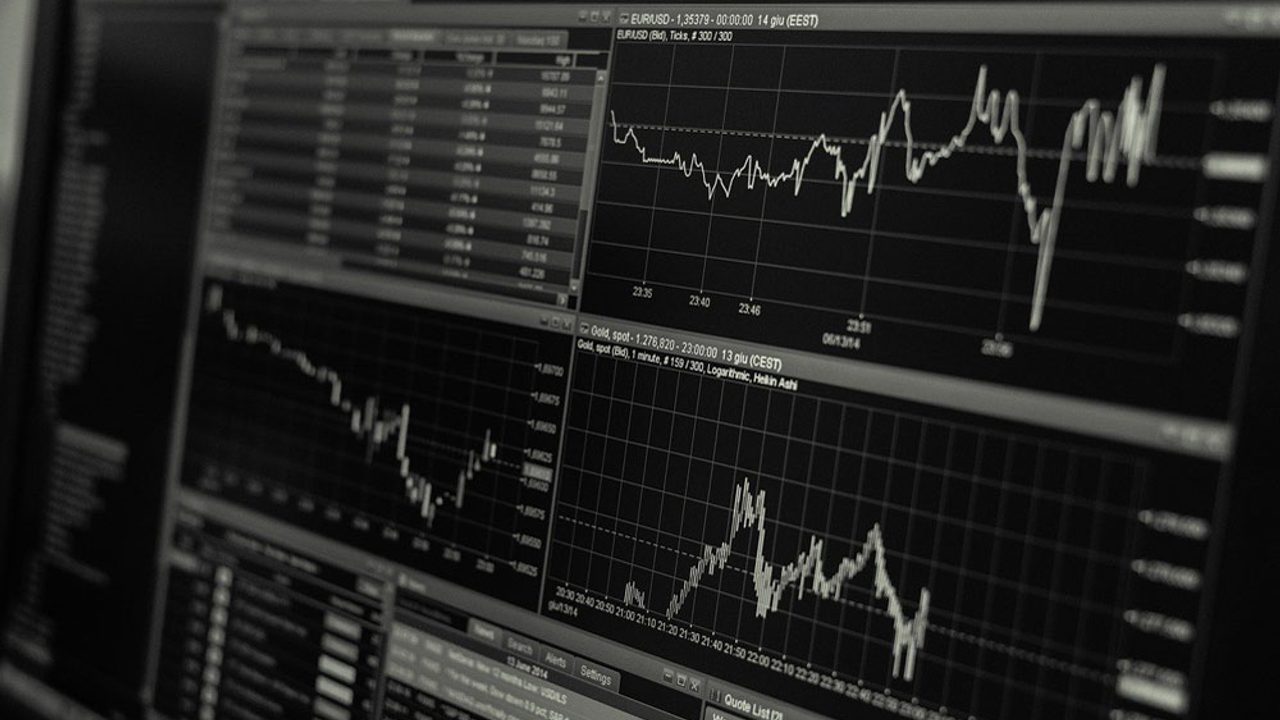
There is more than one school of thought emphasising different elements you’d need to consider when trading cryptocurrencies. The one we are going to look at here is technical analysis. When trading in cryptocurrency, many factors influence the volatile crypto market. In light of this, you will need a reliable strategy to guide and implement your trading. Technical analysis (TA) is a way to create a sound strategy by analysing graphical datasets.
What Is Technical Analysis?
To use TA in crypto trading, you must understand what it entails. Technical analysis provides a way of gaining insights into the history of a currency. This, in turn, should theoretically assist in predicting the movement of the currency into the future. The way that this is achieved is in the use of past and current real-world data in predicting the future of the crypto market. The statistics used to analyse the currency under review include volume and price.
Technical analysis looks for trends and patterns using tools that display this information in analytic charts. These are used to judge the positives and negatives of the cryptocurrency under review. This way, future patterns can be discerned through the market’s noise. This is not to be confused with fundamental analysis, which would be evaluating and reviewing a particular cryptocurrency’s inherent value.
Fundamental analysis is independent of the statistical evaluation itself. TA is used in more traditional trading in stocks, futures, and currencies (to name a few). Therefore, it’s a well-established form of analysis, and its use in these spheres is highly congruent with how they’re used in cryptocurrency analysis.

What Are The Fundamentals of Technical Analysis?
As noted above, technical analysis is used in more traditional asset trading. This means that understanding the fundamentals of traditional TA will help understand its analogue in the cryptocurrency trading market. Charles Dow introduced the fundamentals of the theoretical approach to technical analysis as the “Dow Theory” in the late 19th century, but this has been expanded since then.
The core assumption of TA is that the price of an asset already incorporates the requisite (public) information needed for statistical assessment of fluctuating prices on the market. The practice, therefore, analyses patterns and trends instead of the qualities and attributes of a particular asset. These days, the field accepts three fundamental aspects which inform technical analysis:
1. All Factors Are Incorporated Into The Market
Everything that should impact the price of an asset is already included in the price. From the fundamental attributes of the company to the broad-based psychology of the market, these are assumed as inherent to the price. All that one needs to do is analyse the price trends.
2. There Are Always Trends In Price Movement
No matter the volatility of the market, price trends will always be able to be discerned irrespective of the time frame involved. Therefore, the price of an asset will continue along the path of a past trend rather than fluctuate without reason.
3. History Is Repeated
The belief is that market psychology can be a predictive measure of price movement. Emotional reactions – such as optimism or fear in the market – appear to inform the repetitive nature of price fluctuations. These emotions are alleged to be discernible in analytic chart patterns and subsequently used to understand and/or predict trends. These three fundamental aspects inform the basis of any technical analysis, including when training this strategy upon cryptocurrencies.
How Does TA Influence Cryptocurrency Trading?
Using the above three fundamental aspects, we can see how they can be applied to cryptocurrencies.
1. Cryptocurrency Prices Incorporate All Relevant Factors
When applying TA to cryptocurrencies, it is assumed that everything is inherent in its pricing. The notion of “everything” is broad, but it’s taken literally. Factors such as historical, current, and future demand, current regulations governing crypto, trader psychology, knowledge, and currency information under review: the list goes on. The above factors are inherently included in the price of the currency. This means that while only the prices are analysed, this is enough to discern the sentiment of the market from the prices alone.
2. The Currencies Follow Price Trends
Applying the technical analysis to cryptocurrencies is also based on the notion that price movements and fluctuations are not the product of random processes. Crypto market prices follow movements in both long- and short-term trends. While the market is often volatile, these shorter-term trends can still be analysed and tracked for meaningful speculation. One trend is often followed by its opposite, meaning successful traders using TA can separate these differing trends for increased profit.
3. Trends and Pricing Tend To Repeat Themselves
Assuming this to be true, traders using TA can make meaningful predictions based on previous trends in the analysed cryptocurrencies. These previous trends can effectively inform on probable market fluctuations based upon the historical psychology of market sentiment. To be clear, TA focuses on the reality of “what” is happening based on information in analytic charts. This is opposed to the “why” of what is occurring. In theory, it frees up confounding factors and variables (which can certainly influence any price movement), thus focusing on the simple supply and demand of the relevant market.
Which Tools Are Used During Technical Analysis?
By far, cryptocurrency traders’ most utilised analytical tool is the candlestick chart. As bizarre a name as it is, its choice is obvious when looking at the chart itself: every plot point is in the generally rectangular shape of a candlestick.
These rectangular candlesticks have alternating colours but are often red and green, depending on their relative positions on the chart. They also have a line extending from the top to the bottom (much like a candle wick). All of these factors – candlestick size, line size, and colour – are important for gleaning information on cryptocurrency trends.
The Elements Of A Candlestick Chart
Each rectangle’s top and bottom represent two differing elements. One side represents the opening price of the currency within the time frame in question, while the other represents the closing price within the same time frame. If a candlestick is green, the value of the currency under review has risen. This leaves the opening price at the bottom of the candlestick, with the closing price at its top. If a candlestick is red, the opposite applies, with the currency decreasing in value.
The opening price is now at the top of the candlestick, with the closing price at the bottom. The final element is the wicks, which can come from either end of the candlestick. These wicks represent the highest and lowest prices of the particular currency achieved within the set time frame.
To put it simply, they are a representation of the volatility of the market. These wicks are used to make predictions on the future of a cryptocurrency. For example, long wicks represent a highly volatile marketplace. This could mean huge gains if the market is read correctly and the currency is bought or sold accordingly. The flip side to this is a huge potential for losses as well. Moreover, the high volatility could correct in a short space of time, making things more complicated.
Some Important Elements In The Use Of Technical Analysis Charts
There are a few elements that TA traders use while analysing charts. The first is the trend line which, at its simplest definition, follows the course a cryptocurrency travels in a given time frame. In a volatile marketplace, the predominant and overarching trend must be carefully analysed against minor fluctuations. Choosing your time frame of analysis is also important, depending on your trading style, and understanding the average price of a currency over this time (known as the moving average). And don’t forget those trading volumes are important in ascertaining market sentiment. There are other factors to consider (such as market capitalisation and the Relative Strength Index), but the above hint at the complexities of TA.
A Caveat On Cryptocurrency Technical Analysis
Having stated its clear positive uses in prediction, you shouldn’t only stick to using TA due to the potential effects that real-world information may bear on the market. Important fundamental data on the currencies, news and even software updates could influence the market considerably. For optimum results, you should combine TA with other methodologies to consider these other factors.
Conclusion
As this guide has indicated, TA is an important and complex part of predicting cryptocurrency trends using historical datasets. As a powerful tool in predictive analysis, it is the go-to for most cryptocurrency forecasting. While most analytical tools have TA built into their software, these can be complemented by your reasoned analysis to arrive at promising results.


