


Investing in cryptocurrencies can be a daunting task. This is especially true considering the number of crypto projects currently available. Some projects become pump-and-dump scams where holders lose all their held value.
Learning how to read crypto charts is a great way to figure out what to invest in.
Cryptocurrencies are a fantastic investment and continue to trend and grow their market caps. They have expanded their use cases to payment in crypto gambling games on the best crypto casino and continue to provide value to their holders.
Knowing how to read crypto charts is a vital part of trading crypto. Here is a step-by-step guide to reading crypto charts.
Why It Is Important To Read Crypto Charts
Investors and traders that gain income from the traditional stock market use several tools to predict a stock’s future price movements. They leverage historical data, company earnings reports, and daily news.
They also use stock charts.
Stock charts are like crypto charts. Both track indicators like price point movements and trends.
Cryptocurrencies are volatile assets, so crypto traders need to research cryptocurrencies that they’re interested in. These can be major cryptocurrencies like Bitcoin or Ethereum or penny cryptos like Shiba Inu and Dogecoin.
There are many newcomers in the crypto industry because of blockchains’ decentralised nature. Anyone with a computer and some capital can invest in cryptocurrency. Following this, many websites and trading platforms offer technical analysis tools to aid new and experienced traders.
Depending on the trader’s preference, crypto charts show cryptocurrencies’ 5-minute, hourly, daily, monthly, and yearly price point movements. If a crypto’s price trends upwards for an extended period, it is a bullish price movement. If it trends downwards, it is a bearish price movement.
Crypto charts also show a crypto’s trading volumes, market capitalisation, and a list of crypto holders. Some pricing sites include news related to crypto and where to buy it.

Trading requires adequate timing. If you buy a coin too early, you might miss a momentary price dip and end up overpaying for it. Conversely, if you sell too early, you might miss potential sales profits.
Learning how to read crypto charts gives you a more objective view of a crypto’s price movements. You can make more confident trades by employing technical analysis and various technical indicators.
How To Read Crypto Charts
1. Get Familiar With The Dow Theory
The Dow Theory introduced the concept of Technical Analysis to financial markets. Charles Dow was instrumental in creating the first stock market index in the 19th century. He then started the Dow Jones Industrial Average (DIJA).
This index listed the top 30 public companies in the USA using a price-weighted method.
According to Dow, the stock market held vital information regarding the health of businesses and identifying major market trends. This included whether the economy was heading towards sturdy growth or an inevitable recession.
Learning to read crypto charts includes knowing the Dow Theory’s six tenets, which form the basis of Technical Analysis. With the first tenet, Dow describes three main movements of the market.
Three Movements Of The Market
The first movement, the primary movement, is the major trend of an asset. It can last from 6 months to several years. The main shift shows the asset’s movement towards a bullish trend or a bearish trend.
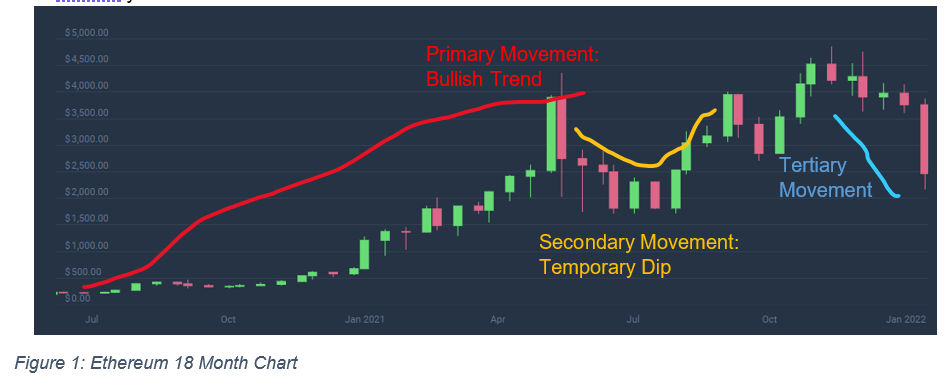
Secondary movement refers to medium trends within the primary movement. They can either follow the primary trend, rise in bearish markets, or experience a temporary dip in bullish markets.
Tertiary movements could either rise or fall over a brief period. These movements do not show a trend change, but day traders could use them to make quick profits.
Three Phases Of The Market
Traders can read these three movements to identify opportune times to invest or divest in a crypto asset. For example, they could buy a coin when its price falls during the second movement and capitalise on the coin’s price rising again because of its primary bull movement.
However, it isn’t easy to recognise the beginning of the secondary movement because the primary movement also has three phases, according to Dow’s second tenet.
The first phase, accumulation for bull markets and distribution for bear markets, is a phase before a trend moves in the opposite direction. This happens when investors have positive expectations for the market in a bear market and negative expectations in a bull market.
Experienced traders who know how to read crypto charts either sell their assets (in a bull market) or buy assets (in a bear market, expecting an opposite trend to emerge. This means they either profit or buy an asset at a discounted price. The asset’s price does not change much during this phase because there are few experienced traders.
The second phase, absorption/ public participation, occurs when other traders realise the experienced traders’ motives. More traders begin investing in the asset, and it rises in price.
The last phase, panic in bear markets and excess in bull markets, begins when traders continue to invest in the asset. Experienced traders buy the asset in a bear market before the bullish trend begins. The more experienced traders in a bull market sell off their assets as they prepare for the bearish trend to begin.
The Market Discounts All Information And News
The third tenet states that a stock’s price on the market includes all information about the asset’s value. This includes earnings reports, news, and buyer and seller sentiment. So, once a news report mentions the asset, the asset’s price changes in the market. The price is an all-encompassing reflection of the performance of a company.
Averages Must Correlate
Dow’s fourth tenet states that a new trend only begins when two indices (assets) correlate. This means that both assets move in the same direction in the market.
For example, many older cryptocurrencies rely on Bitcoin’s price in the crypto industry. So, if Bitcoin’s price increases, other coins tend to follow Bitcoin’s lead. If this is not the case, a new trend will not emerge.
Volume Validates Trends
The fifth tenet states that an asset’s trading volume needs to match a market’s trend. Trading volume refers to how much an asset changes hands over a period. Traders use this as a validation indicator after looking at movements and phases.
A bearish primary movement has fewer trades during the trend, which confirms the declining trend. If a bullish primary movement has more trades during the trend, it confirms the rising trend.
Trends Continue Indefinitely
The sixth tenet states that a market will continue its trend until an external factor affects it. This means that trend reversals are not that common. All technical indicators must point to a reversal before a trader can be certain it will occur.
2. Learn About Technical Analysis
The technical analysis developed by Charles Dow entails looking at an asset’s price history and trading volume to predict future price movements. With those tenets as a basis, you can use technical analysis on various crypto charts.
Those that use technical analysis believe that market trends tend to repeat themselves. Therefore, looking at past trends will give them a sign of when the market will reach that trend again.
3. Use Technical Indicators To Make Predictions
Knowing how to read crypto charts involves various technical indicators to make predictions. Some tools determine volatility, momentum, and moving averages, to name a few. The aim is to find primary movements and the various phases in the movements.
Crypto Market Chart Timeframes
Depending on their aim, traders will consider different chart timeframes. Intra-day traders usually look at a crypto’s 15-minute chart to identify tertiary price movements. They perform multiple daily trades and rely on these minor movements to generate profits.
Long-term traders look at 4-hour daily or weekly charts. These traders seek profits from primary movement trend changes or temporary secondary movements.
Cryptocurrency Market Capitalisation
Cryptocurrencies’ market capitalisation (market cap) shows how valuable it is. You can multiply a coin’s circulating supply by each coin’s price. For example, a penny crypto like BakeryToken has a market cap of 193,529,486.13 x $0.5851 = $113,230,579.
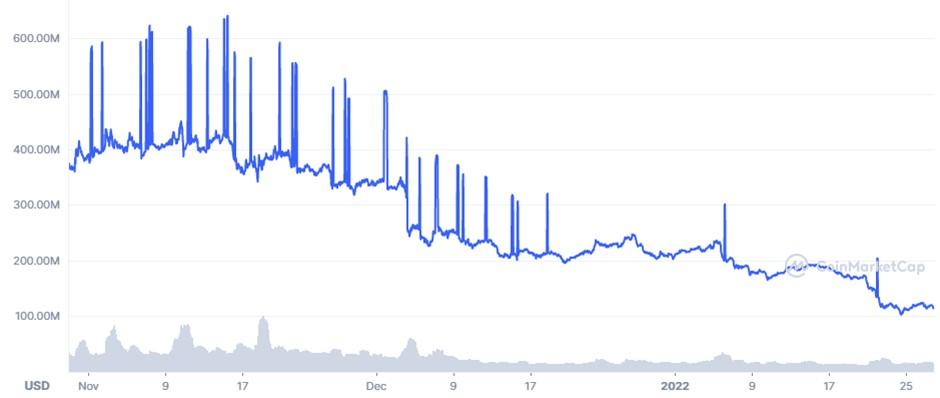
Figure 2: BakeryToken 3-Month Market Cap
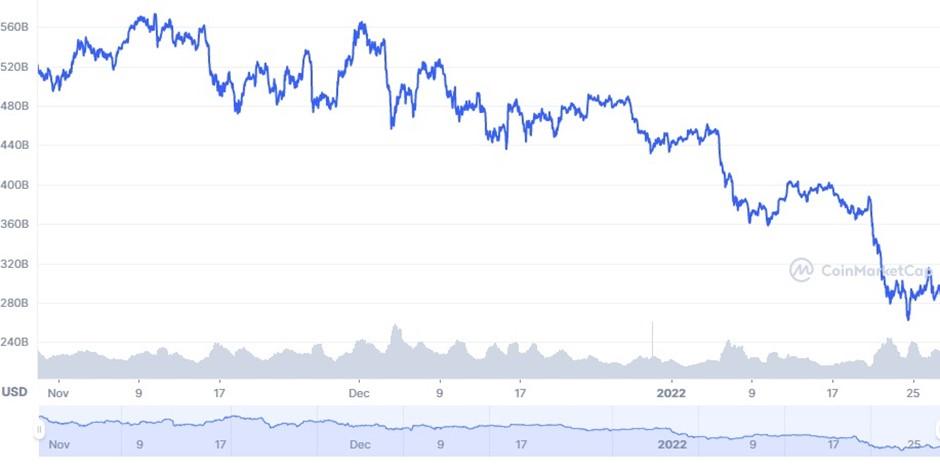
Figure 3: Ethereum 3-Month Market Cap
How to read crypto charts includes looking at a coin’s market cap as an indication of a cryptocurrency’s growth stability. By looking at BakeryToken’s 3-month market cap compared to Ethereum, you can see much more volatility on the BAKE chart. At the same time, Ethereum shows a more stable decline in market cap at the end of January.
On-balance Volume Indicator
A crypto asset’s trading volume is an important indicator for identifying trends. Joseph Granville created the on-balance volume indicator (OBV) because he believed that trading volume was vital to an asset’s growth.
Traders can calculate an asset’s OBV by looking at its closing price. The formula includes the closing price and the current trading volume. This is to determine if the trading volume confirms the price movement. If the price increases, so do the OBV. If it decreases, so does the OBV.
4. Examine Candlestick Crypto Charts
How to read crypto charts includes knowing different charts. There are line, log, and candlestick charts. The latter is useful when looking for price movements because they include more information than other charts.
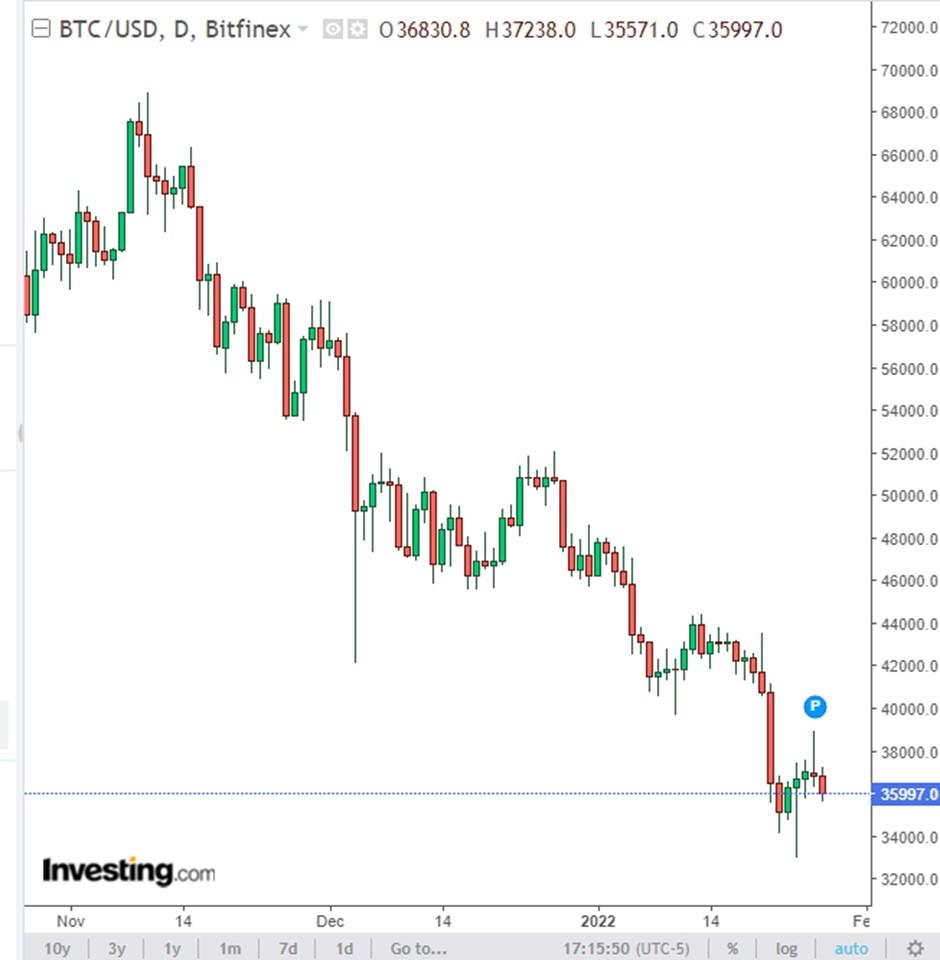
Figure 4: BTC/USD 1-Day Chart
The figure above shows a typical trading pair crypto chart. The vertical axis shows Bitcoin’s price in US dollars, and the horizontal axis shows the time frame. This chart includes BTC / USD price movements from November 2021 to January 2022.
Moreover, A candle is either a red or green solid body on the chart. The lines on top and at the bottom of the candles are shadows. The body of the candle shows the open and closing prices of Bitcoin. Each candle in the above chart shows one day. If the candle is green, Bitcoin’s price increased that day. And the shadows show the high and low prices of that day.

Shadows can reveal trader sentiment during a given period. In the above figure, the candle on 11th December shows a green candle with mostly body. This means that traders have a strong bullish sentiment. The red candle on 4th December has a long shadow. This shows that traders are buying Bitcoin after every price drop. After practising how to read crypto charts, you can identify these patterns with more frequency.
5. Other Important Technical Indicators
Support And Resistance Levels

Figure 6: Bitcoin 1-Month Chart
The resistance level is a zone on a chart in a given period (figure 6: December 2021) where the price movements do not exceed a price. Here, Bitcoin’s price reaches just over $5200 but falls the next day. On the 7th and the 27th. This makes $52000 the resistance level. Frequently, the price breaks resistance but comes down a few days later.
The support level is a zone on a chart where the price movement does not go lower than a price. Here, Bitcoin does not fall under $45500 several times. It also goes below the support but finishes above it. Recently, it has reached new lows that could show a bearish trend approaching.
Moving Averages
Moving averages (MA) are quite common among crypto traders because analysts can adjust the average according to a period. This makes it apt for analysing 24/7 crypto charts.
Simple Moving Average (SMA) is one of the more common versions of the MA. The formula follows: (Price (P) + P + P+P)/ number of periods. You take the sum of all the prices in a period and divide it by the number of periods.
Final Thoughts
Learning how to read crypto charts takes some practice, but a basic understanding will help you on your journey of investing in and trading cryptocurrencies.
Knowing how to read candle charts, identify bull or bear sentiments, and look at support and resistance levels is a good start.


